A success story recently carried out by teltesk has been the support in the expert work after an agricultural accident. For privacy reasons, certain data cannot be exposed in this article.
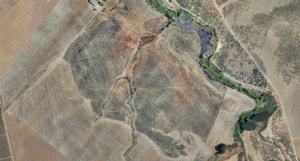
The reason for the service is the study of an area damaged by fire that occurred during harvesting work on a productive farm. The damaged harvest is insured by the company that was carrying out the harvesting tasks at the time of the fire. According to information provided by said company, the incident affected two different types of crops within the same area. Information on the actual division of the acreage will be determined by the statement made by the property for the harvest. Given the impossibility of accurately measuring the crop distribution, this information is the most reliable on which to work. The work is carried out in coordination with an agent of the insurance company, interested in having a second measurement of the surface.
First of all, we proceed with the high-quality digitization of the affected area, using a drone equipped with a standard 12-megapixel resolution RGB camera. Multiple partial photographs of the area are taken at regular intervals, with a constant overlap index and always maintaining the same flight altitude with respect to the surface, respecting the limits set by current legislation. With each of these images the information of the GPS coordinates from which the shot is made is also stored.
Through the use of specific photogrammetry software, an orthomosaic image is generated, which is perfectly georeferenced through the information of all the coordinates stored during the flight operation. Consequently, said file reproduces the real measurements – distances and areas – of the digitized surface.
Finally, through the use of specific software for the analysis of GIS images, we proceed with the study of the damaged surface.
As can be seen, the segmentation of the burned area is simple at first glance since the color differentiation does not require the use of an algorithm that separates the pixels by color difference. In this way, it is only necessary to vectorize the damaged area manually in order to proceed with the calculation of the area. Three main areas are generated first.
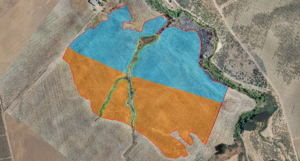
Thanks to the graphic document declaring the campaign of that year in which the subdivision into plots of the SIGPAC precincts are registered on the plan. These plans, once incorporated into the GIS interpretation software, allow the calculation of the intersection surfaces of each crop with the damaged area.
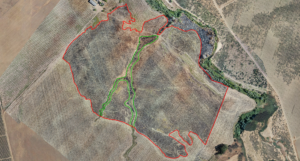
Knowing the values declared in the Graphic Declaration of the 2020 campaign and the values obtained in the analysis software when generating said polygons, the possible error made in the digitization of the plots was studied.
| Sup. Gráfica (ha) | Sup. Medida (ha) | Erro absoluto (ha) | Error % | |
| Parcela a | 27,12 | 27,10 | -0,02 | -0,07% |
| Parcela b | 43,00 | 42,51 | -0,49 | -1,14% |
| Parcela c | 13,01 | 12,82 | -0,19 | -1,46% |
| Parcela d | 9,00 | 8,67 | -0,33 | -3,67% |
Measuring the areas, the value of the damaged area is obtained according to the type of crop that is being declared in each of the plots. Given that, at the time of digitization of the plots, it was found that with respect to the official data recorded there was a certain percentage variation, it is assumed that the intersections generated carry said surface error, therefore, to compensate, of applies an equal correction factor with the opposite sign to each of the intersections, resulting in a value much closer to the total value measured, so it is inferred that the error is minimal.
| Cultivo A | Cultivo B | Corrector | Cultivo A | Cultivo B | |
| Interseccción A | 9,83 | 0,07% | 9,84 | ||
| Interseccción B | 5,82 | 1,14% | 5,89 | ||
| Interseccción C | 6,47 | 1,46% | 6,57 | ||
| Interseccción D | 8,53 | 3,67% | 8,84 | ||
| Total | 15,65 | 15,01 | 15,73 | 15,41 | |
| 30,66 | 31,14 | ||||
The calculation of the measurements of the surfaces is carried out by default in the SI (International System of measurements) and therefore the values obtained are in square meters (m2). This value is divided by a factor of 10,000 to obtain the result in Hectares (ha) and is displayed with a precision of 2 decimal places.
Given the perfect georeferencing of the images, the margin of error possibly committed by this concept is less than 1%. In the case of low-quality image georeferencing, as occurs in this process, it has been found that the error can amount to around 3%. Another of the errors that may have been made is related to the criteria in the selection and manual marking of the damaged area, however, this error is almost completely rulable, given the similarity of the results that have been obtained redundantly by two different methods.